

The Weekly.

Hey friends,
It’s been two weeks since my last weekly forecast. I’ve been working through some personal things and tinkering with my models—you wouldn’t be wrong if you were thinking my Twitter has been shifting more to the crypto/sentiment space than the comforts of weird derivatives liquidity things.
On another note, I mentioned a few weeks ago that I’m likely going to start releasing long form content through a paid Substack, with the majority of profits going to a charity. Why majority? I was advised—on Twitter nonetheless—that I may end up owing taxes on it (not an accountant), so it seems like a more happy medium (or Substack) to just allocate around 70-80% or so to charity, and the rest to pocket for potential taxes. Worst case, I’ll use it to buy more data, or just donate it at tax time.
I’m a big fan of transparency, so all profits and earnings through it (and the charity) will be published on the Substack. Additionally, depending on the content, I’ll probably a week later just release it live to everyone (not sure yet). I believe at current I’ll continue to do my free weekly forecast though.
Well. Back to our regularly scheduled programming.
Last week was weird. If you don’t follow nopechart.com, you still probably felt the weirdness when pretty much every single indicator indicated something was amiss. I’ve personally ragged on the Relative Strength Indicator, a technical indicator indicating the strength of a trend, but as of current, SPY is overbought on every single timeframe (except arguably the 5 year timeframe). Similarly, NOPE warned us somberly on Monday:

Unfortunately, this was not the best week to play NOPE. This tends to happen when the market has a strong directional trend, coupled with other weird factors (including the continually diminishing volume):


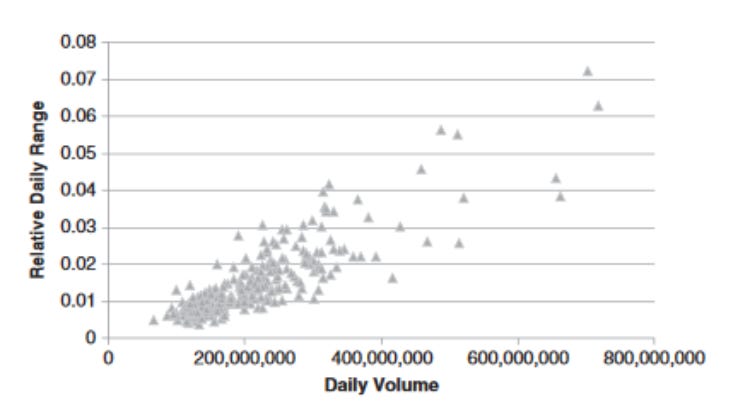
I’ve remarked before on this (check out my post on Volatility, Liquidity and Returns) but there’s an interesting and sort of paradoxical relationship between perceptions of liquidity. In general, an illiquid asset tends to have higher volatility over the long timeframe—this is intuitive, as price tends to fluctuate more when an asset is illiquid. However, there’s a strongly negative correlation between realized volatility on the daily timeframe and trading volume (one measure of liquidity, albeit a poor one). To note, this relates to relative trading volume (between days)—if you compare a highly traded stock over time to itself, a low volume day is likely calm and green. However, over the long term comparing a highly traded stock to a thinly traded one, we expect the latter to have significantly more realized volatility.
An illiquid market tends to creep up steadily, and this was similarly observed in summer 2020. Without any strong catalyst and diminishing volume, the market tends to be dominated by two factors:
1) Fluctuations around an equilibrium price—in the absence of new participants or information, we can fairly well assume (and model it, using an Ornstein-Uhlenbeck process) that price should be roughly fixed at a certain level, with temporary oscillations due to buying and selling patterns intraday. However, in the face of greatly diminished volume, this can actually significantly shift the price (due to reduced market depth).
2) Large buyers/sellers - as we saw during the fun Archegos deleveraging two Fridays ago, with diminished volume comes reduced market depth. With reduced market depth each concurrent buy or sell has increased impact on today’s price. This can cause fairly dramatic effects:

Woosh.
Last week, being the lowest recorded volume this year, was probably dominated by required hedging of options. This is implied by NOPE as well as other resources-option volume did not decrease like equity volume did.
More interestingly, the clustering of high NOPE values on Monday and on Friday—which ended up tying roughly for the highest observed end-of-day value in my records, except for days before SPY ex-dividend—seem to parallel trends observed in August 2020. This similarly occurred with a prolonged rise in megacap tech, which led to the appearance of two similarly extraordinarily elevated NOPE readings right before the correction began:
8/28/20

9/2/20

That said, hesitant to make a call of a current correction window for two major reasons.
1) The level of extreme bullishness we saw last week is pretty rare—while for more reasonable NOPE levels (30-80 or so) there tends to be a pretty cleanly visible monotonic relationship with next day being red, the value observed on Friday is so outside the norm it’s hard to really speculate what it means.
2) Gamma Week/The Opex Cycle—SPX has an interesting monthly cycle due to the expiration dates of VIX and SPX options, and the general preponderance of institutions being short calls (covered calls) and long puts. @KeyPaganRush on Twitter created an excellent short video on this topic:
One of the side effects of the OPEX cycle is that the gamma of the nearest strike options tends to rise dramatically as OPEX week unwinds:

This essentially leads to observed pinning, which reduces realized volatility (at least usually) in OPEX week/Gamma week, and makes it hard for an appreciable selloff to take hold.
This tends to cause a pretty distinct rise in net gamma (which one can see using SqueezeMetrics’ GEX tool) starting the Thursday/Friday right before OPEX week, usually). Interestingly, I noticed correlations between GEX and NOPE this week:
1) In general, playing reversions has worse expected value in times of negative gamma—when GEX is negative, this implies dealers are in a short gamma zone (roughly), which leads to increased realized volatility. This seems to make at least naive reversion strategies work worse overall.
2) There is a significant relationship between the maximum intraday NOPE and the prior day’s GEX — in times of high GEX, the next day maximum NOPE tends to increase substantially. We observed this on Friday and Monday (in general, shorting based on the current site thresholds seems to work worse).
This could mean a few things:
1) Despite our model telling me otherwise, my hunch would be that we’re in a period of weakness, caused by the upward movement largely driven by hedging and other passive or systematic flows. This was reflected heavily in last week’s NOPE readings (NOPE tends to take more extreme values naturally when volume is diminished).
2) This week being Gamma Week I would not anticipate significant realized volatility, but stranger things have happened. The extraordinary GEX and NOPE readings on Friday classically predict a very light red day (last Tuesday, after Monday’s elevated NOPE we ended around -0.08% at close), but the strong bullish undercurrent might say otherwise (and of course, our EOD model accounting for other factors also predicts green tomorrow).
3) Interestingly, a trader recently made a rather large bet on future volatility. I’m reluctant to ascribe much meaning to this bet, simply because we don’t know at all the intent. I hope the journos writing about it at least verified it was a debit spread, and it seems to be the case in the article. That said, it could also simply be to hedge vega. VIX seems to have firmly broken the 20 modal threshold that defined it for much of 2020. It’s unclear if it stays this low, but I’m reluctant to believe there’s a much larger sell ahead (despite the everything bubble).
4) Recommendation at this point is short gamma long theta with a slightly short delta bias for this week. That means selling out-of-the-money call spreads for example (not to say that’s the preferred approach or not). This could also be paired with strategic long volatility positions, although with a longer dated, less negative carry bias probably. Past or towards the tail end of this week we could potentially see a pickup of realized volatility as much of the delta from the OPEX week unwinds (although we tend to see gamma pinning the last hour or so due to the impact of charm/increase in at-the-money option gamma).
I may write a part two to this, but until next time. Also remember that taxes aren’t due for another month now, so breathe a sigh of relief for procrastinating.
Cheers,
Lily
Volume is almost the opposite of liquidity, the DOM and number of limit orders by level should give you a clearer picture of liquidity. Realized volatility increases when the volume:liquidity ratio is high
Thanks Lily. Curious about the negative GEX being worse for NOPE reversions. When you did that study, were you looking at reversions on the day of the negative GEX, or were you looking at reversions the NEXT day from the negative GEX?